“Reserve Bank extends EMI Holiday” screamed the newspaper early in
the morning of 22nd November 2016, amidst those chaotic days of Rs.500 & Rs.1000 "demonetization".
“RBI allows both individuals and firms
with loans upto Rs. 1 crore an additional grace period of 60 days to repay
dues”, said the paper.
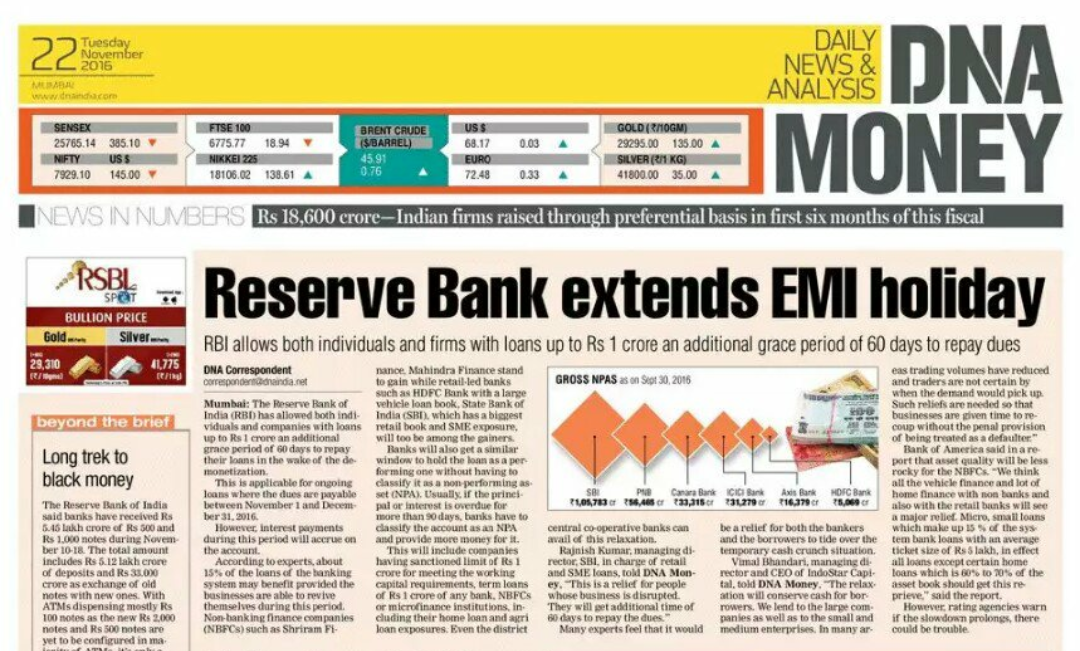 |
| ...except that there was never any EMI holiday |
“Demonetization: RBI gives small borrowers 60 extra days to repay
credit”, said another - a leading financial daily, “…small borrowers who have been facing the brunt of demonetization,
would get an additional 60 days to repay their credit, including agriculture
and housing loans”.
Similar reports were carried by
most newspapers that day, and repeated ad
nauseum by television channels for several days thereafter. There was
however one small problem – the news was completely wrong.
 |
| Most media houses wrongly reported the news |
What RBI had said
What then had caused the press to
report something like this, which wasn’t true at all? The answer to this lay in
a circular issued by the Reserve Bank of India, put up on its website the
previous day. The circular, titled “Relaxation in Prudential Norms”, said “…it has been decided to provide an
additional 60 days beyond what is applicable for the concerned regulated
entity(RE) for recognition of a loan account as substandard in the following
cases…” and cited a wide gamut of loan accounts where this benefit will be
applicable. Read the full circular here.
The operative term here is ‘additional 60 days…for recognition of a loan
account as substandard’ which was misinterpreted to mean borrowers getting an
extra 60 days to repay their EMIs or other dues. In fact, the RBI circular clearly mentioned “…this is a short-term deferment of
classification…” and that this “…does
not result in restructuring of the loans”. Shorn of its jargon, this means
there is no change in dates when the borrowers have to repay, but if they do
not, banks can have an additional 60 days to do what they do when the borrowers do not repay.
Understanding NPAs
News reporters and financial
journalists aside, I have seen even analysts tracking the banking sector struggle with
these terms. When banks give loans, the loans appear on the asset side of a
Balance Sheet. A repayment goes on to reduce that asset, while a fresh
disbursement increases these assets. However, not all loans get fully repaid,
and occasionally a customer defaults. This leads to a capital loss for the
bank, as the assets have to be written off. To an extent, such losses are
considered ‘normal’ in the banking business, and prudence requires that banks
prepare for them well in advance. This is where ‘provisioning’ comes in.
Provisioning means banks booking
an ‘expense’ entry in the Profit & Loss account based on the expected
losses arising from such defaults. Provisioning reduces reported profits of the
bank and creates a capital buffer, which can be used when the losses actually
occur. The amount of provisioning to be done is prescribed by the RBI, and
depends on the ‘quality’ of the asset. The worse the quality, higher the
provisioning, since lower are the chances you will ever recover your money.
Asset Classification
This is where ‘Asset
Classification’ comes in. RBI requires banks to classify all loans in four
groups – Standard, Sub-standard, Doubtful and Loss. Initially, all loans start
as ‘Standard’. Assets under the other three categories are collectively called
“Non-Performing Assets” or NPAs. NPAs are loans where principal or interest has
not been received for more than 90 days beyond its due date. The RBI defines ‘Sub-standard’
as an asset which has remained an NPA for a period less than or equal to 12
months. After 12 months as an NPA, the asset degrades to ‘Doubtful’. ‘Loss’
assets are assets where the bank feels there is no hope of recovery from the
customer at all. If an EMI was due on 5th February 2017
and the customer failed to pay, the loan would become ‘sub-standard’ on 6th
May 2017 (i.e. 90 days after this date). Twelve months after this date i.e. from
6th May 2018 onwards, the loan will be called a ‘Doubtful’ asset.
Note the following peculiarities
in this:
1. A
loan does not become an NPA immediately after default. For 90 days, it continues
as a ‘Standard’ asset, though conventionally one is inclined to equate 'standard’ assets as those where the customers are repaying on time. Thus, given that demonetization was announced on the
evening of 8th November 2016, even an asset due on 9th November
and remaining in default would not become an NPA on 31st December
2016. And this even without taking recourse to the extra 60 days provided by
the above circular.
2. There
is no hard & fast definition of a ‘Loss’ asset, it is based on a subjective
assessment of the bank about the recoverability of the loan. In theory, a loan may
continue to be classified as ‘Doubtful’ for several years after default,
without ever being moved to ‘Loss’.
Why this classification matters is
that the ‘provisioning’ banks are required to do – which, as we saw is an
‘expense’ and hits the bank’s profitability - depend on the category of the
loan, progressively increasing as the loan moves down the quality lane from
Sub-standard to Doubtful and Doubtful to Loss. RBI even requires banks
to make provisioning on Standard assets.
Gross & Net NPAs
When banks declare their
financial results, the 'Gross NPA’ and ‘Net NPA’ levels of the bank receive a lot of
attention. The summation of assets under the category Sub-standard, Doubtful
and Loss – are called the ‘Gross NPA’ of the bank. If you deduct the amount of
provisioning done from the Gross NPA, the resultant figure is the ‘Net NPA’ of
the bank. But we have seen above that provisioning is an arbitrary number –
partly driven by a regulatory minimum, partly driven by the bank’s own
discretion. This makes 'Net NPA’ also an arbitrary number. ‘Gross NPA’
however is a much more tangible number – it tells precisely the amount of loans
overdue by 90 days or more. There is
no subjectivity around it.
The NPA figures are often quoted in
terms of percentages. When bank results are declared at the end of every
quarter, analysts look at the ratios ‘Gross NPA %’ and ‘Net NPA %’ to determine
the quality of bank's assets. Gross NPA % is calculated as ‘Gross NPA of the bank (as described earlier) divided by standard advances
plus the gross NPAs’ of the bank i.e. effectively the sum of all loans
outstanding as on the date of calculation. Net NPA% is calculated as the ‘Net
NPA of the bank (as described earlier) divided by net advances’ i.e. sum of all
loans outstanding less the provisioning for NPAs.
Note that only the absolute
change in the Gross NPA comes close to showing the true movement of NPAs of the
bank. And that too, with the lag of one quarter! That is, Gross NPA as of
end-December minus the Gross NPA as of end-September will account for fresh
defaults that have taken place in the July to September - and not the October
to December - quarter! Net NPAs are distorted by provisioning, and both the ‘percentage
ratios’ (Gross NPA% and Net NPA %) are distorted by the denominator. A bank can
issue fresh imprudent loans and inflate the denominator, thus showing low NPA%.
These fresh loans would become NPAs earliest only in the next quarter because
of the 90-day rule.
It’s not over yet. There are
write-offs too!
Even difference in Gross non performing assets
doesn’t tell the full story of bank’s NPA movement. NPAs are further impacted
by the assets “written off” during the period. And this figure may only be available
from the Annual Report once a year. Written off assets are reversed completely
from the asset book, reducing the Gross NPAs of the bank and the overall asset
base itself.
Coming back to RBI circular
mentioned earlier, all that the RBI said was that for loans with due dates
between 1st November 2016 to 31st December 2016; banks
have an extra 60 days – beyond the normal 90 - to recognize them as NPAs. They
would become NPAs only if they remain unpaid for 150 days after the due date
i.e. between 30th March 2017 to 31st May 2017
respectively, instead of 30th Jan 2017 to 31st March
2017. The asset classification and the amount of provisioning the banks have to
do, would be guided accordingly.
As far as the borrowers are concerned, there was no change
in their obligations to the bank; their due dates remained the same. There was
no “EMI holiday” nor any “extra 60 days” to repay their credit.
